“A great discovery solves a great problem, but there is a grain of discovery in the solution of any problem.”
So said George Pólya, the author of a foundational volume in mathematics, How to Solve It.
Desmos is a built-in, powerful graphing calculator that all Digital SAT takers not only CAN use, but should use, on at least half of the problems. Of course, the better your foundational algebraic and mental math skills, the better you can set up the problems. But as Pólya observed, you will see the grain of discovery sprout once you experiment with the graphic capabilities of Desmos and understand how it presents its solutions.
Like cheat codes in a video game, these hacks will help you power up to the next level on your math section. Let’s dive right in, with real digital SAT problems and how Desmos can cut back on your solution time.
Quadratic Functions
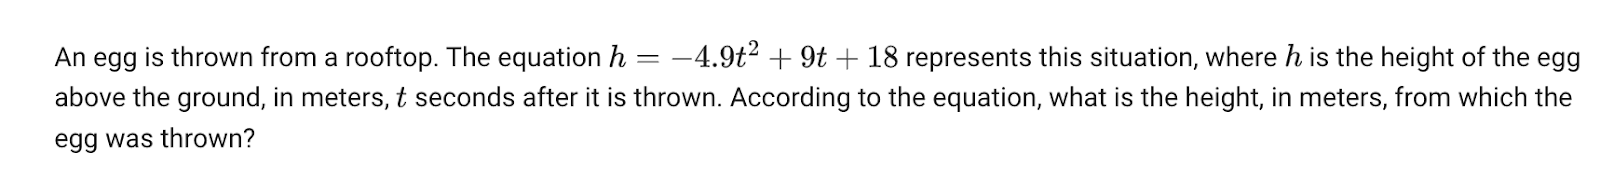
This is a straightforward representation of a quadratic function. You can solve this problem multiple ways, but we suggest simply inputting the equation and examining its graph to look for the desired point.
DESMOS TIP: REPLACE ANY INDEPENDENT VARIABLE WITH X AND ANY DEPENDENT VARIABLE WITH Y. THESE ARE THE VARIABLES DESMOS UNDERSTANDS.
Now that we replaced the height function with y, and the variable of time with x, we can visually see a representation of the egg’s height over time.
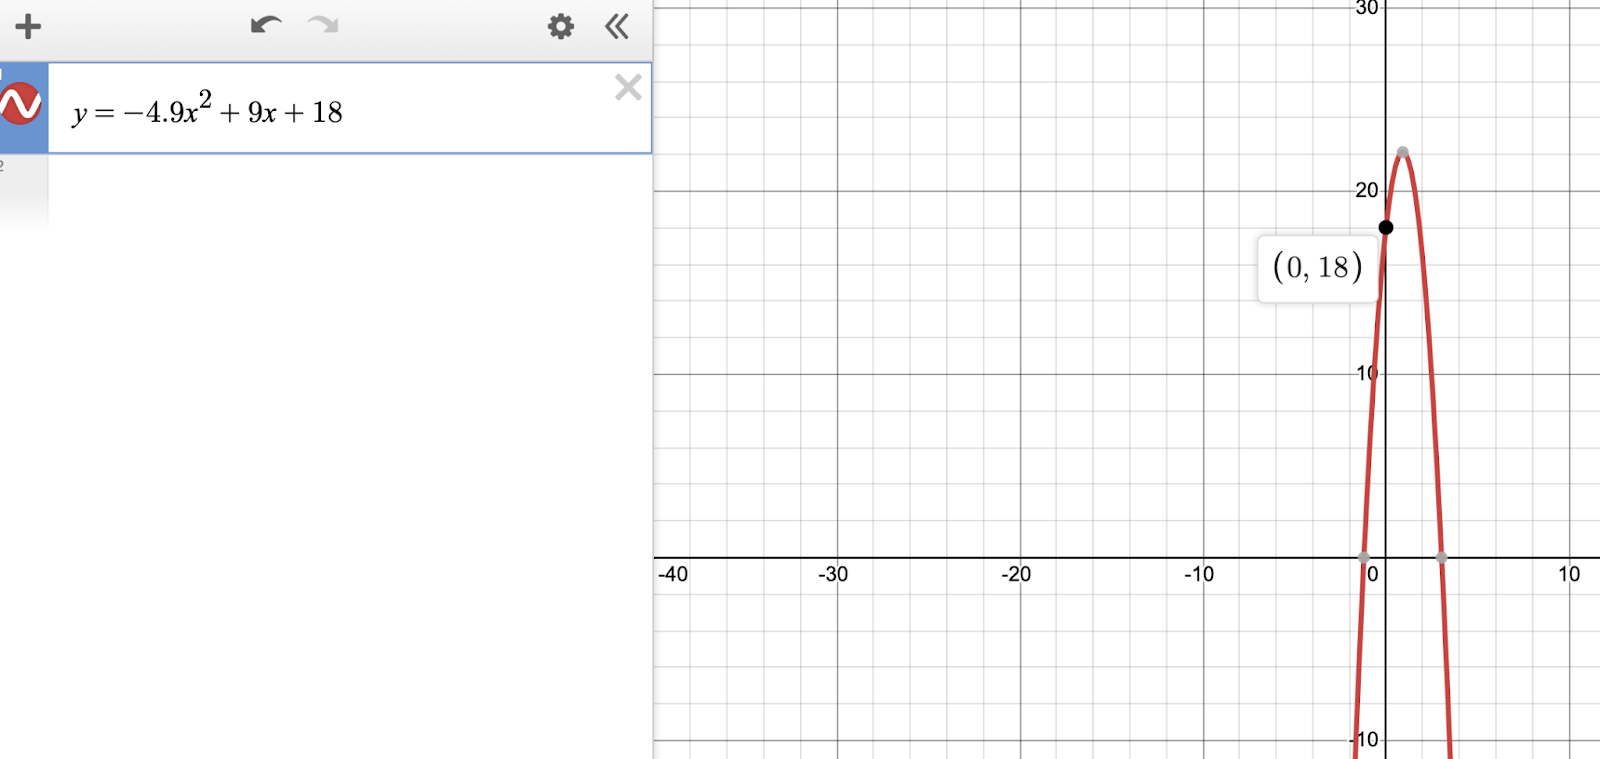
But how do we interpret this word problem?
At x=0, no time has passed. That means the moment the egg is thrown is represented by the y-intercept — the output of the function at x=0. As you can see in the image, the egg was thrown from a height of 18 meters. Since this is a free response question, input 18. Egg over easy!
Alternatively, we can recognize that the quadratic equation is in the form y=Ax^2+Bx+C, so the value of C tells us the intercept, instantly. That confirms 18 is our answer.
Circles
Circles are an advanced algebraic concept that many of us file away after graduation. What’s the (h,k) again? (Answer: stay posted.)
But fortunately, Desmos graphs circles more elegantly than any Texas Instruments calculator. Let’s use Desmos to confirm our algebraic instincts on this circle SAT problem.
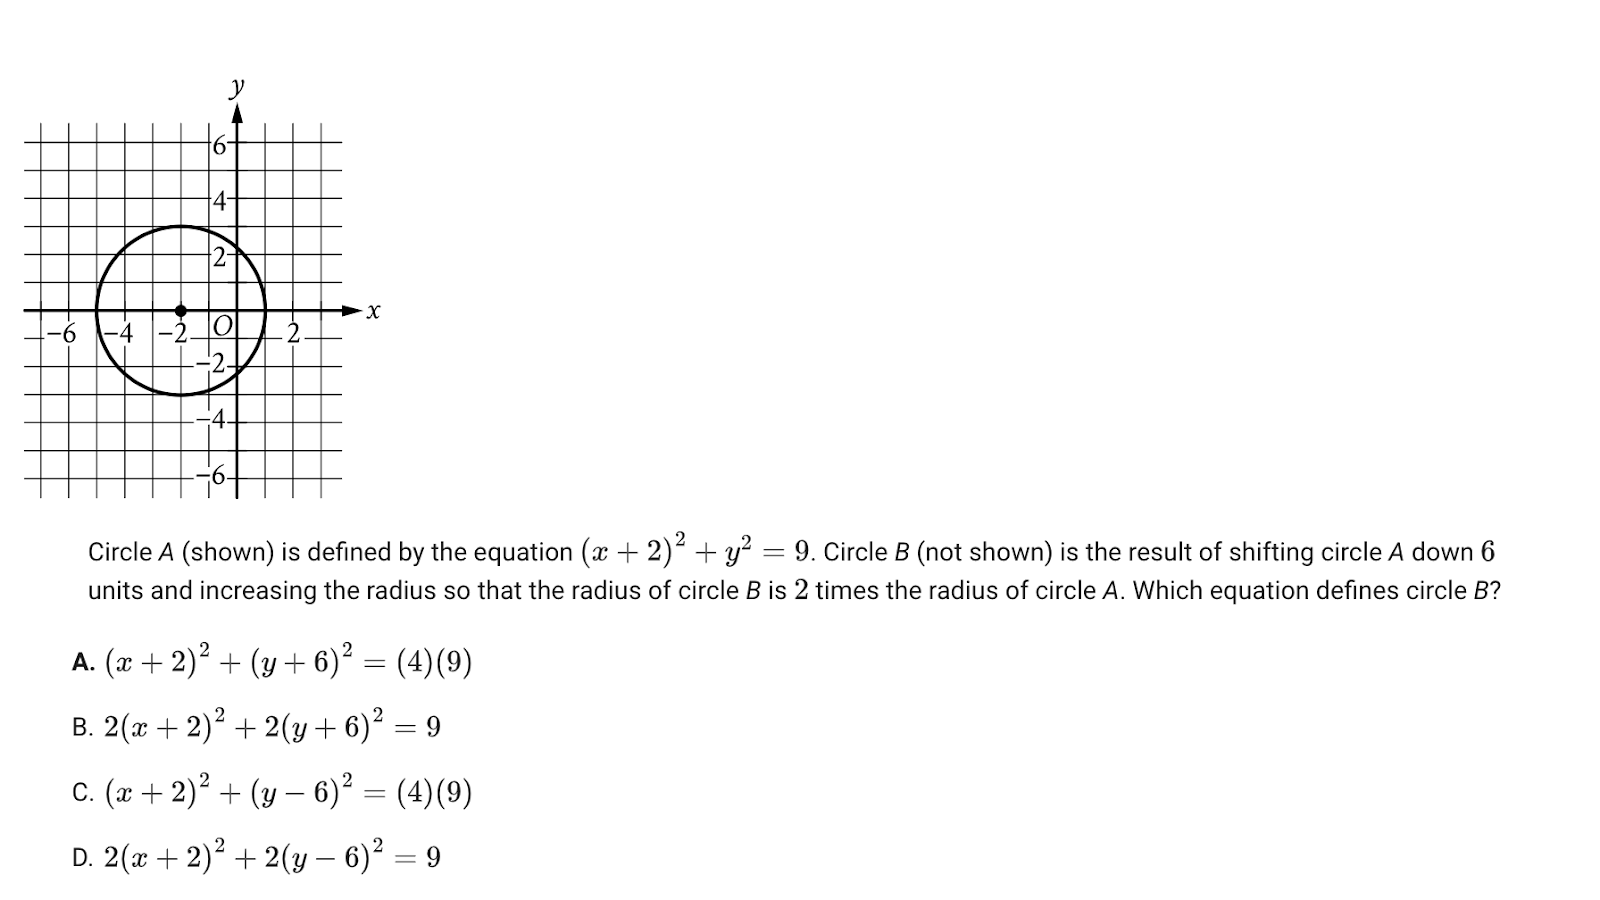
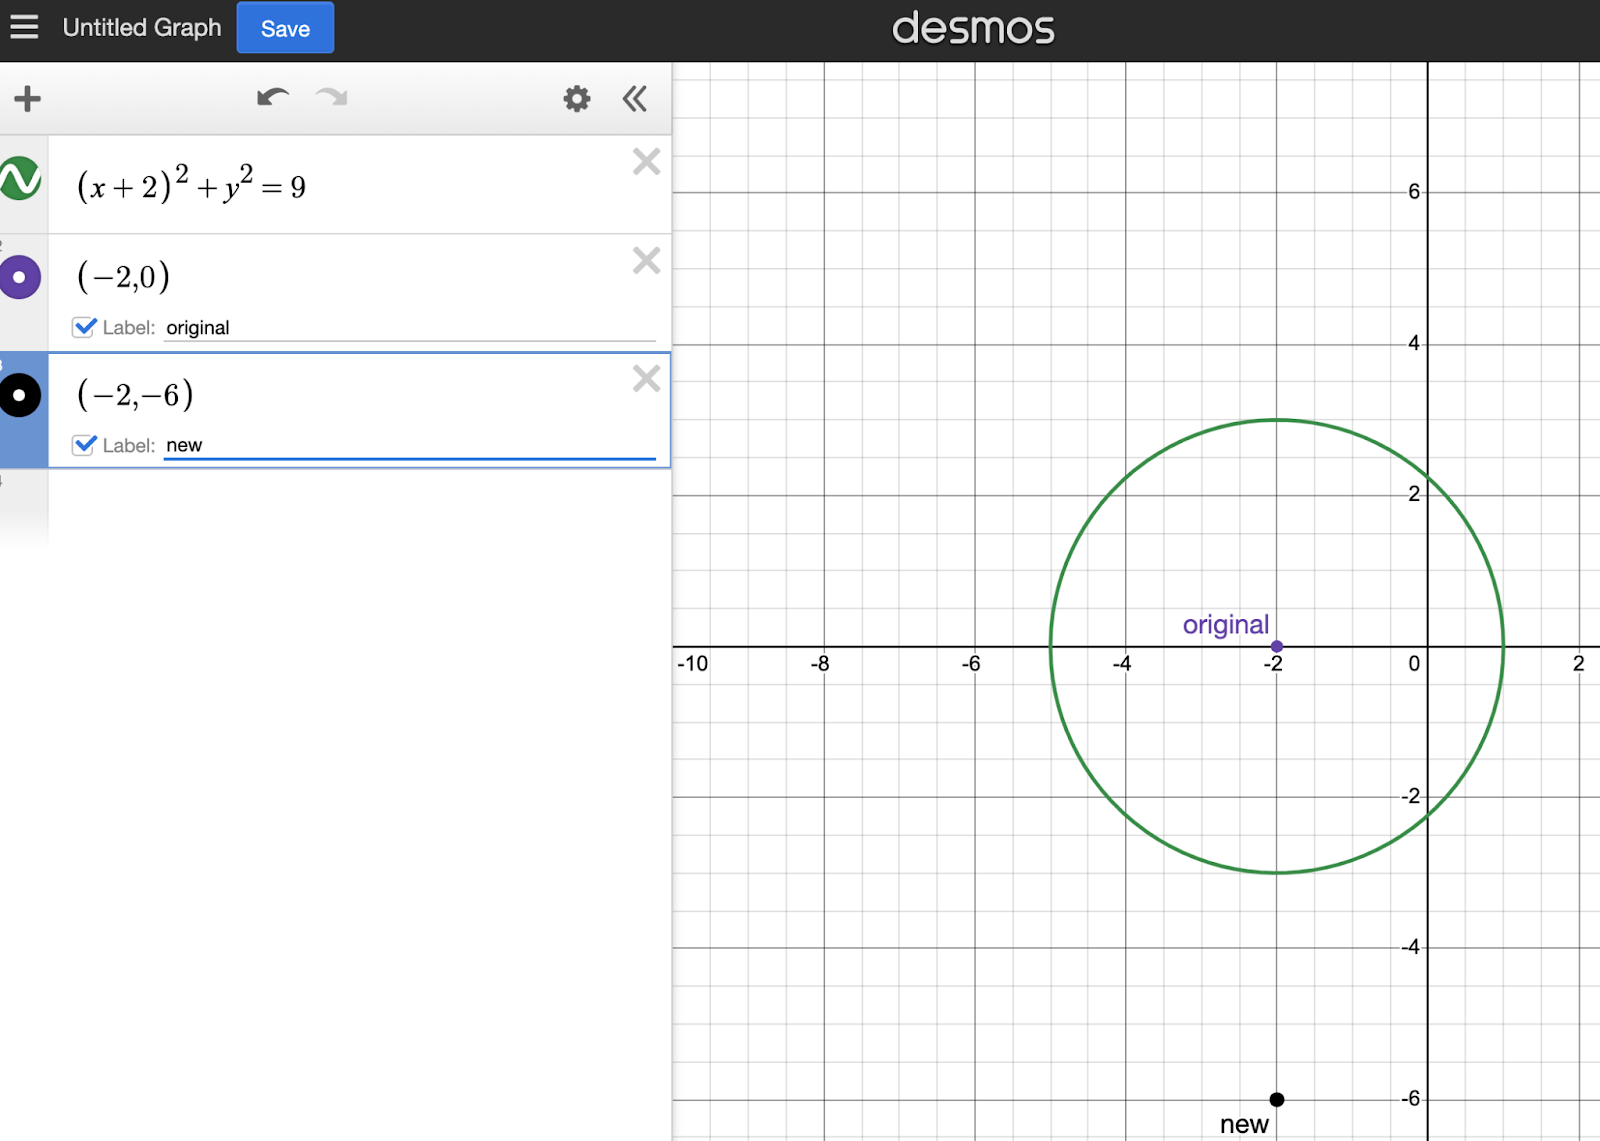
They made our work easier by giving us BOTH the equation and the visual representation of our circle. Go ahead and enter the circle’s equation into Desmos, to reproduce the original graph, like so:
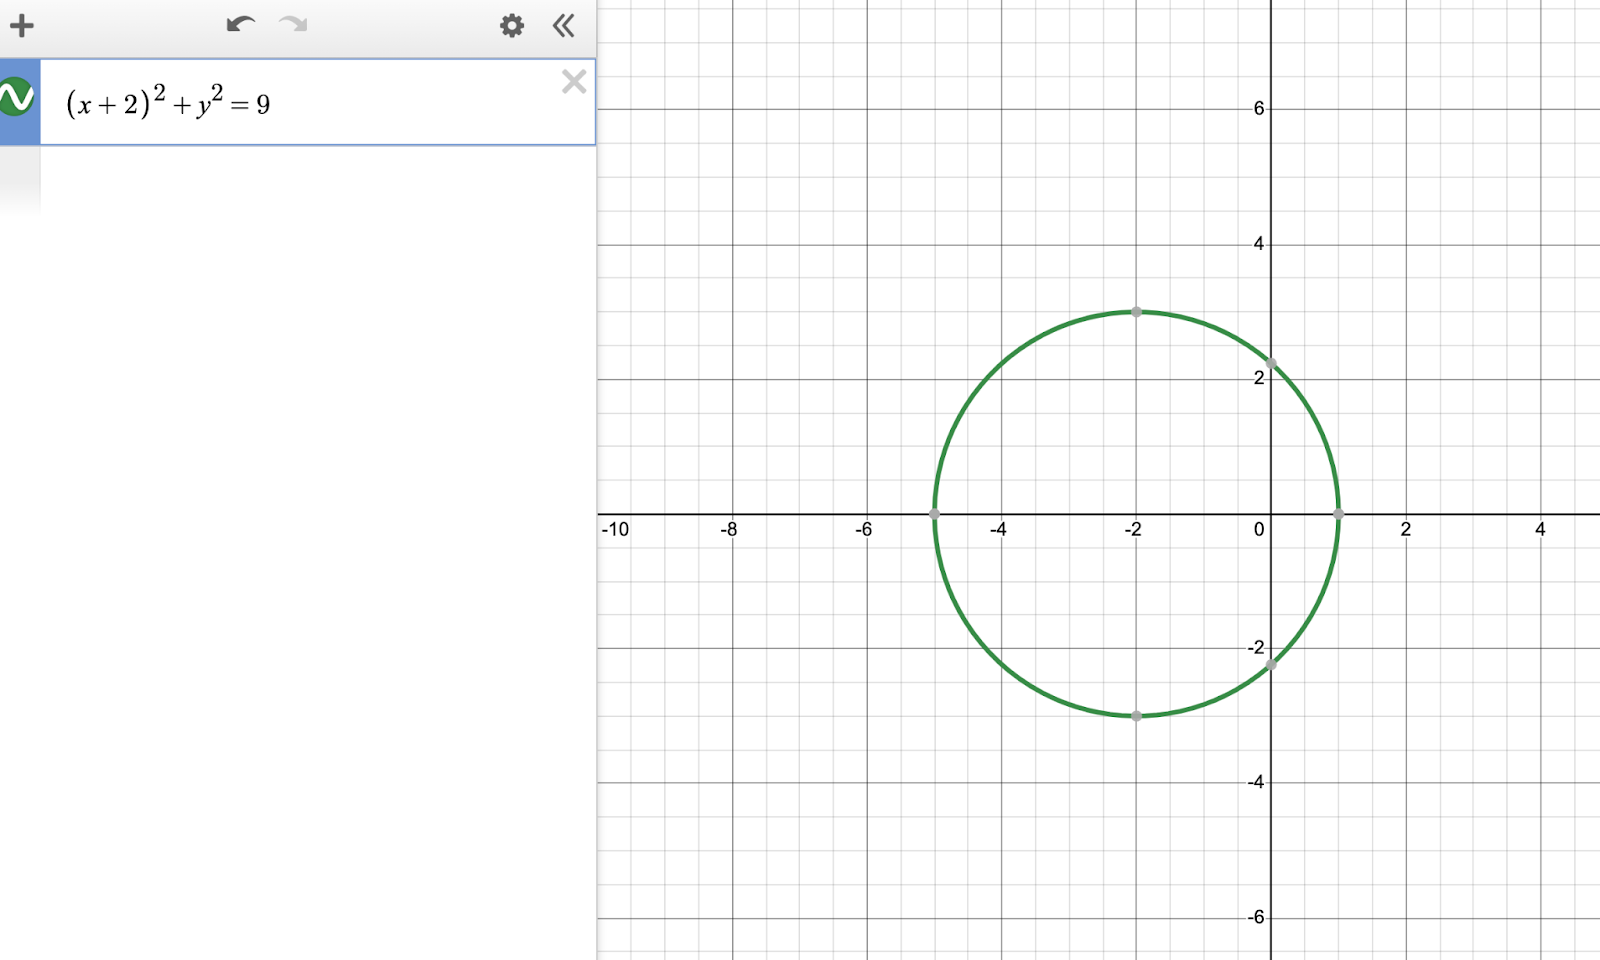
It’s important that the student actually type the above — unlike the web browser edition, you CANNOT use the copy/paste function on your keyboard.
DESMOS TIP: USE THE RIGHT ARROW TO COMPLETE SUGGESTED CLOSED PARENTHESES, AND THE SHIFT + 6 TO INPUT THE ^ FOR EXPONENTS.
Let’s confirm the two properties we’re changing: the original center and the original radius.
(h,k) is represented by the standard circle equation like so:
(x-h)^2 +(y-k)^2=r^2
(h,k) is the center of your circle: note the negative signs before each constant. Since our circle’s center is shifted left, we expect the h value to be positive, in this case. Visual confirmation confirms the value we see in the algebraic equation: h is -2 and k is 0. (The circle is not shifted up nor down from the x axis.)
How do we downshift 6 units? On a PS-64 console, maybe you repeatedly hit the down arrow, but in the Cartesian plane, our cheat code is that right/left shifts are affecting the h, while up/down shifts are affecting the k. (Go back and look. Do you see why?)
(-2, 0) shifted down 6 units becomes (-2, -6). For fun, we can input these points into Desmos and it will even label them! Note, however, that this would waste time on a real SAT, but can help solidify function transformations if you need the practice visually before test day. Example:
So we know where our new (h,k) values are. Let’s compare that to our answer choices and use process of elimination (POE) to get rid of any wrong answers:
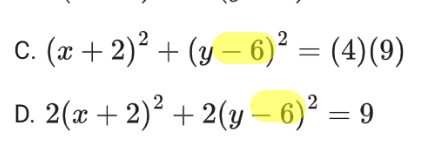
Both C and D incorrectly interpreted k. Remember, a center at (-2,-6) means your k needs to be POSITIVE 6 in the equation!
So now we’re left with A and B, which only differ on the radius.
The only tricky part here is interpreting r^2 as a square. You can visually confirm that the circle passes through (1,0). Using distance formula or simple counting, we can confirm that the radius is 3 units.
That means the 9 in the original equation won’t simply be doubled: first you have to take the square root, double it, and then square it again.
Let’s do that math in Desmos:
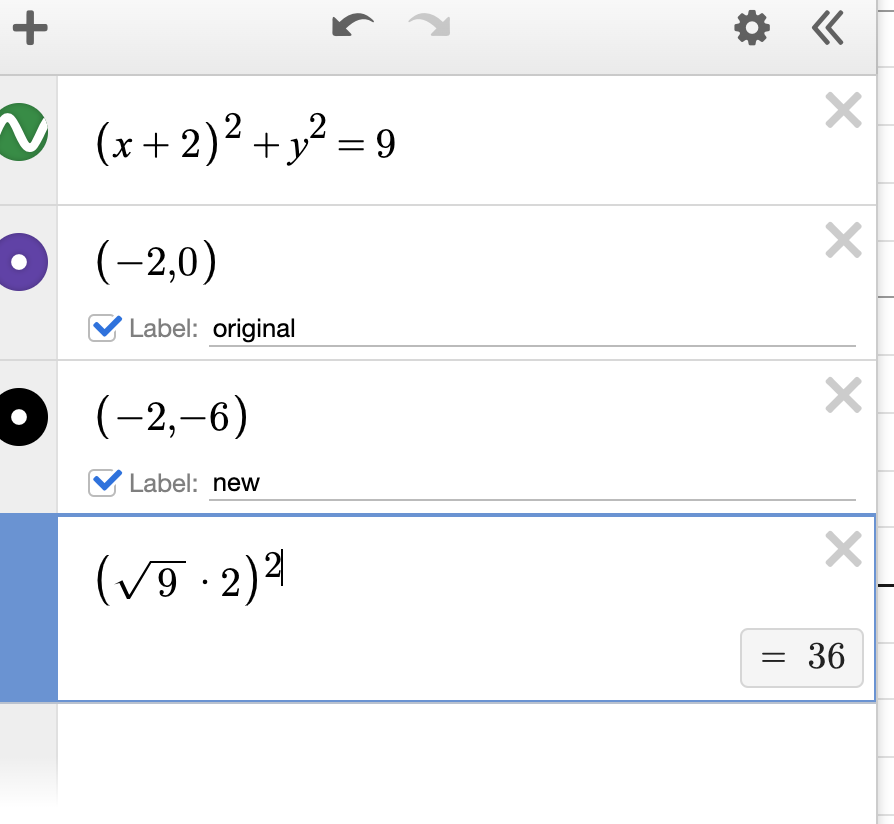
Correctly did the order of operations — but where’s 36 as the r^2 in the answer choices?
Well, you can also think of expanding this expression as the squaring applying to each term:
(√9)^2 * 2^2 = (9)(4)
Should be simpler now to compare that to answer A as our right answer.
Again, you can solve this problem algebraically, but it can be helpful to have Desmos for visual confirmation of transformations, calculations, and even inputting each answer choice to see visually which circle is shifted down and twice the radius. Unlike a regular calculator, it can interpret circles exactly as given!
Systems of equations
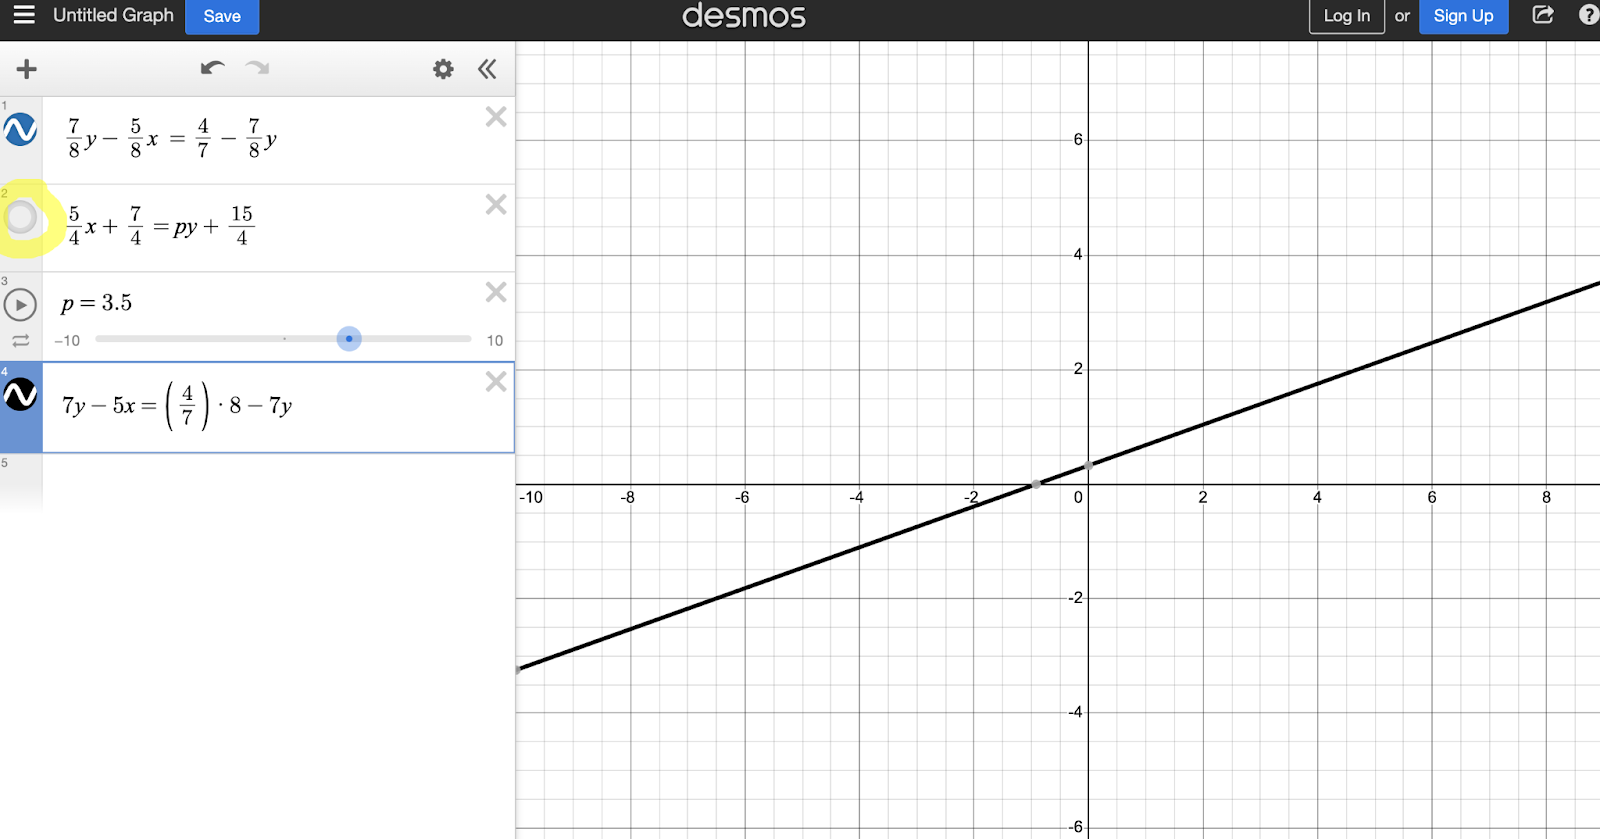
The Digital SAT loves systems of two equations with two unknowns, and often adds a twist. You should always use a Desmos approach when you see a system of two linear equations. Let’s try a trickier one and look into how Desmos uses sliders.
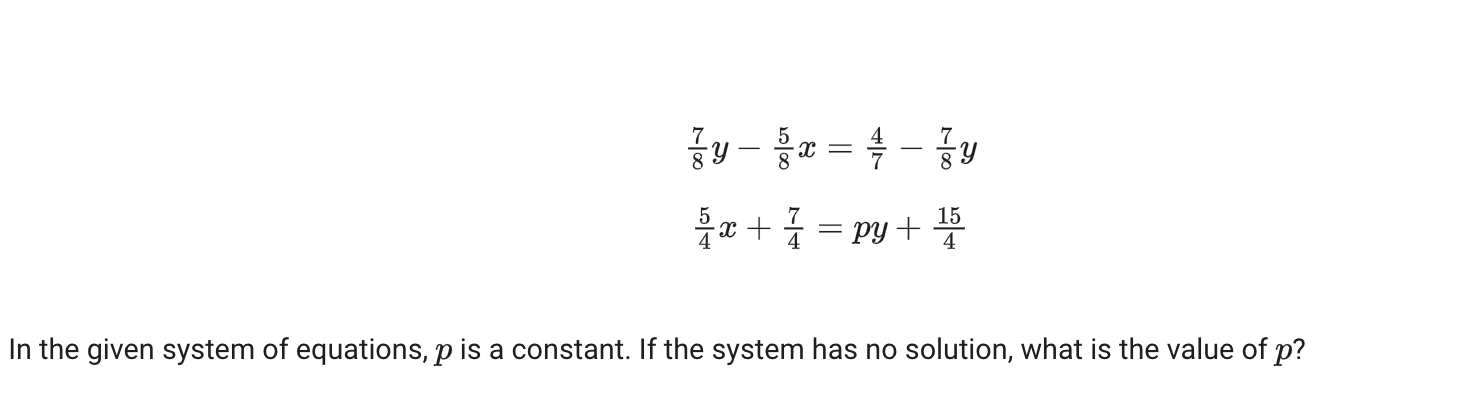
You can confirm that each equation is a line since they each have x and y terms. You don’t have to go through the headache of combining like terms: Desmos will do that for you and spit out the lines. Try it, but see what happens when you use p.
(Again, you can’t use copy and paste, so you’ll have to type these. Use the / for your fractional coefficients. Inputting / first can make the filling-in of fractions easier. Small Pólya discovery!)
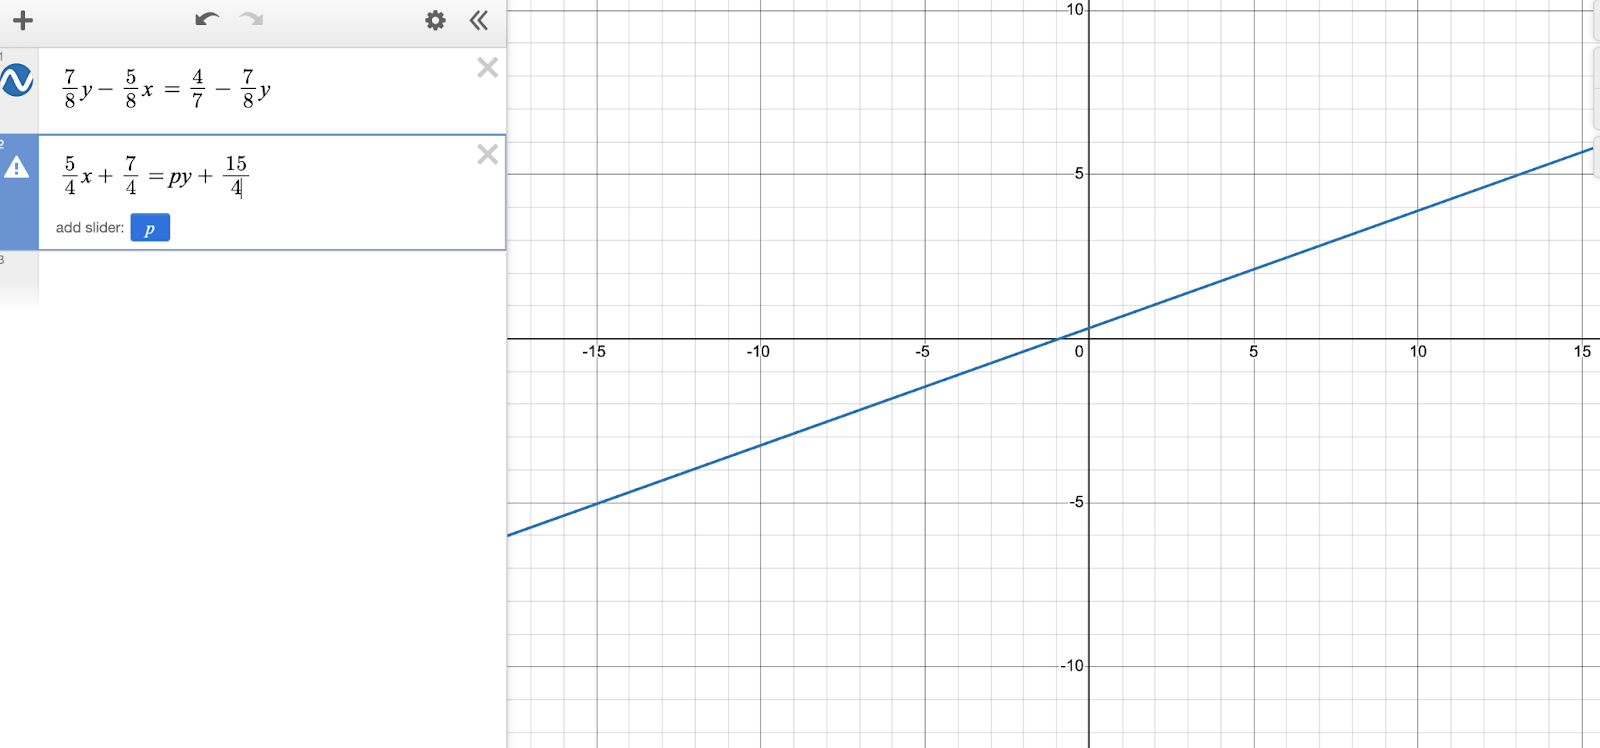
We’ve unlocked an ability, like Mario finding a coin. A slider is how Desmos lets you adjust a constant and see the shape of the second line change accordingly.
Having “no solutions” means, by definition, the slopes must be equal while the intercepts differ. (For the algebraic whizzes, they’ll remember that once we group our equations into standard form, that means we can look at the value of -A/B for each line, and isolate p once the second line’s slope is equal to the first line’s exact slope, but let’s not get ahead of ourselves. Let’s see if the slider can work its magic.)
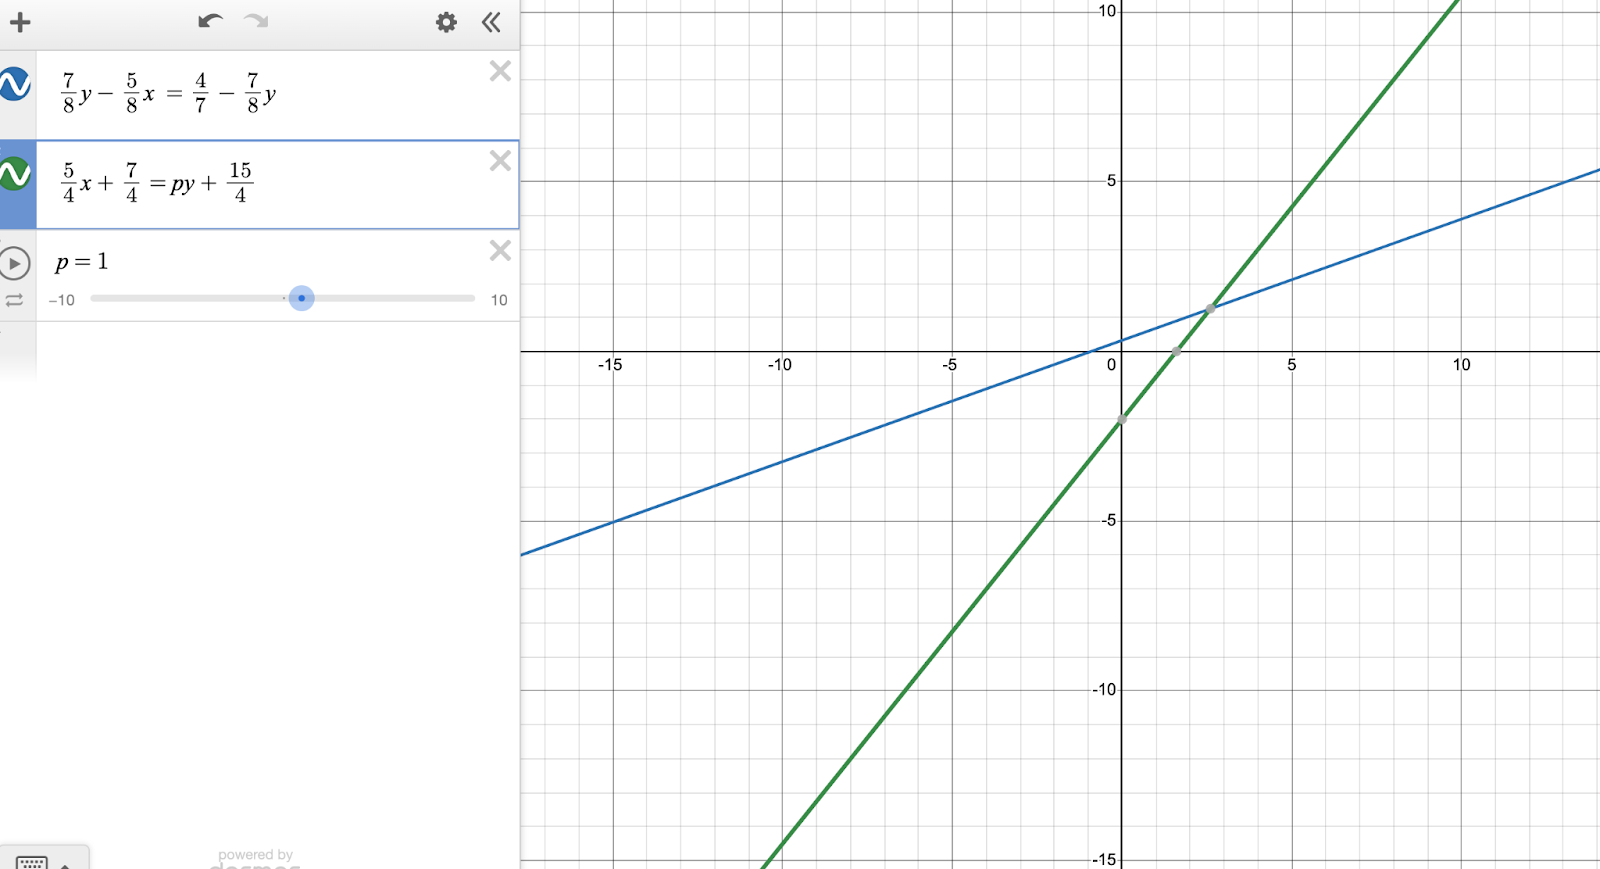
Here’s the system when p=1. Clearly has a solution.
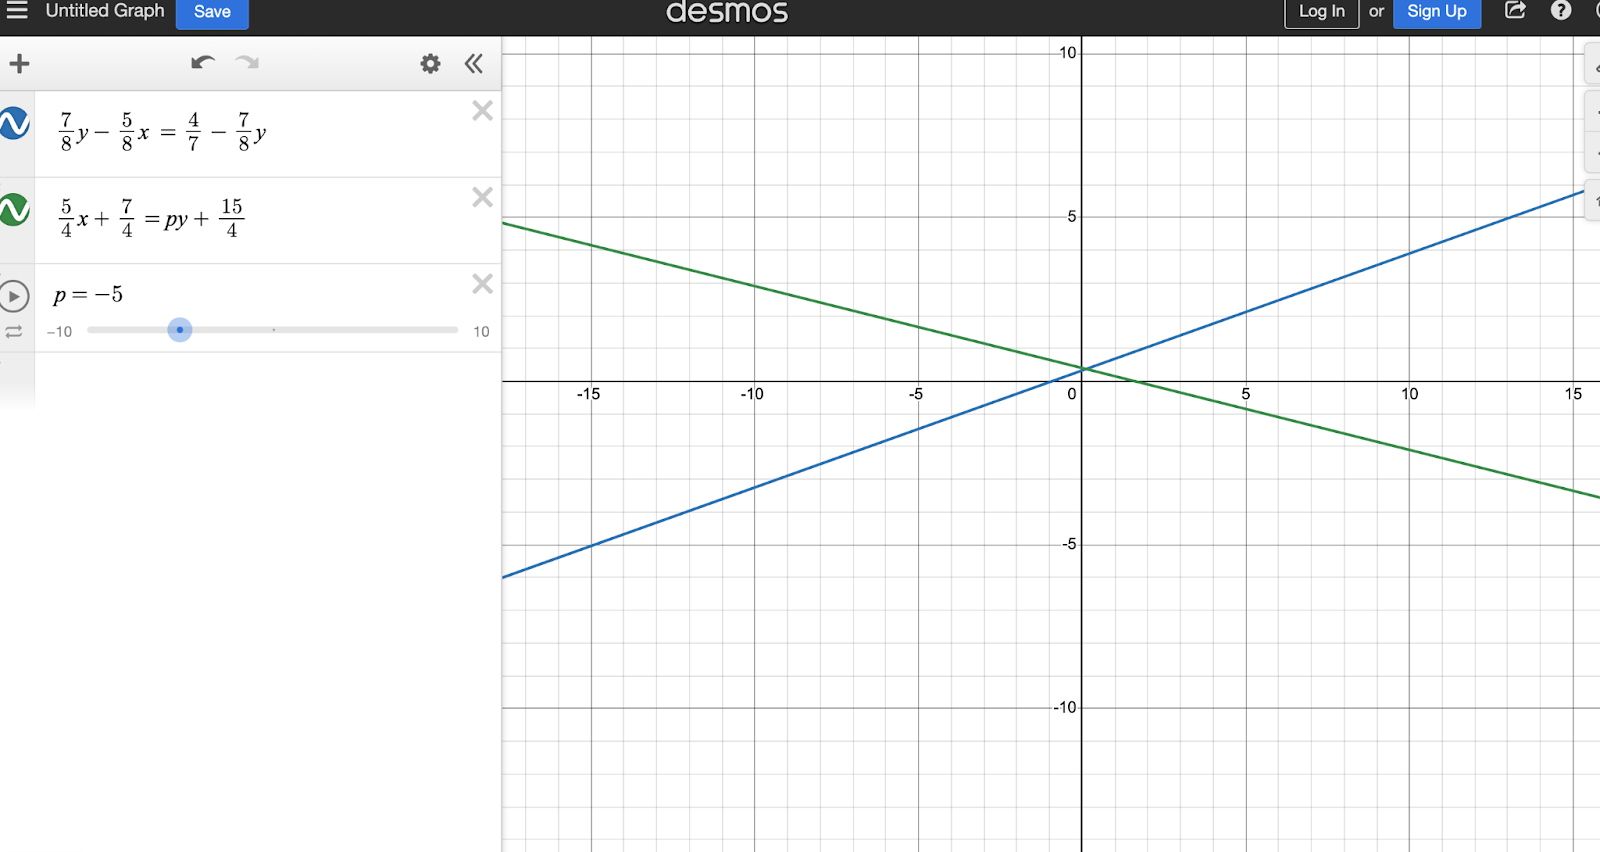
Ditto p=-5.
Try sliding yourself until you get visually parallel lines.
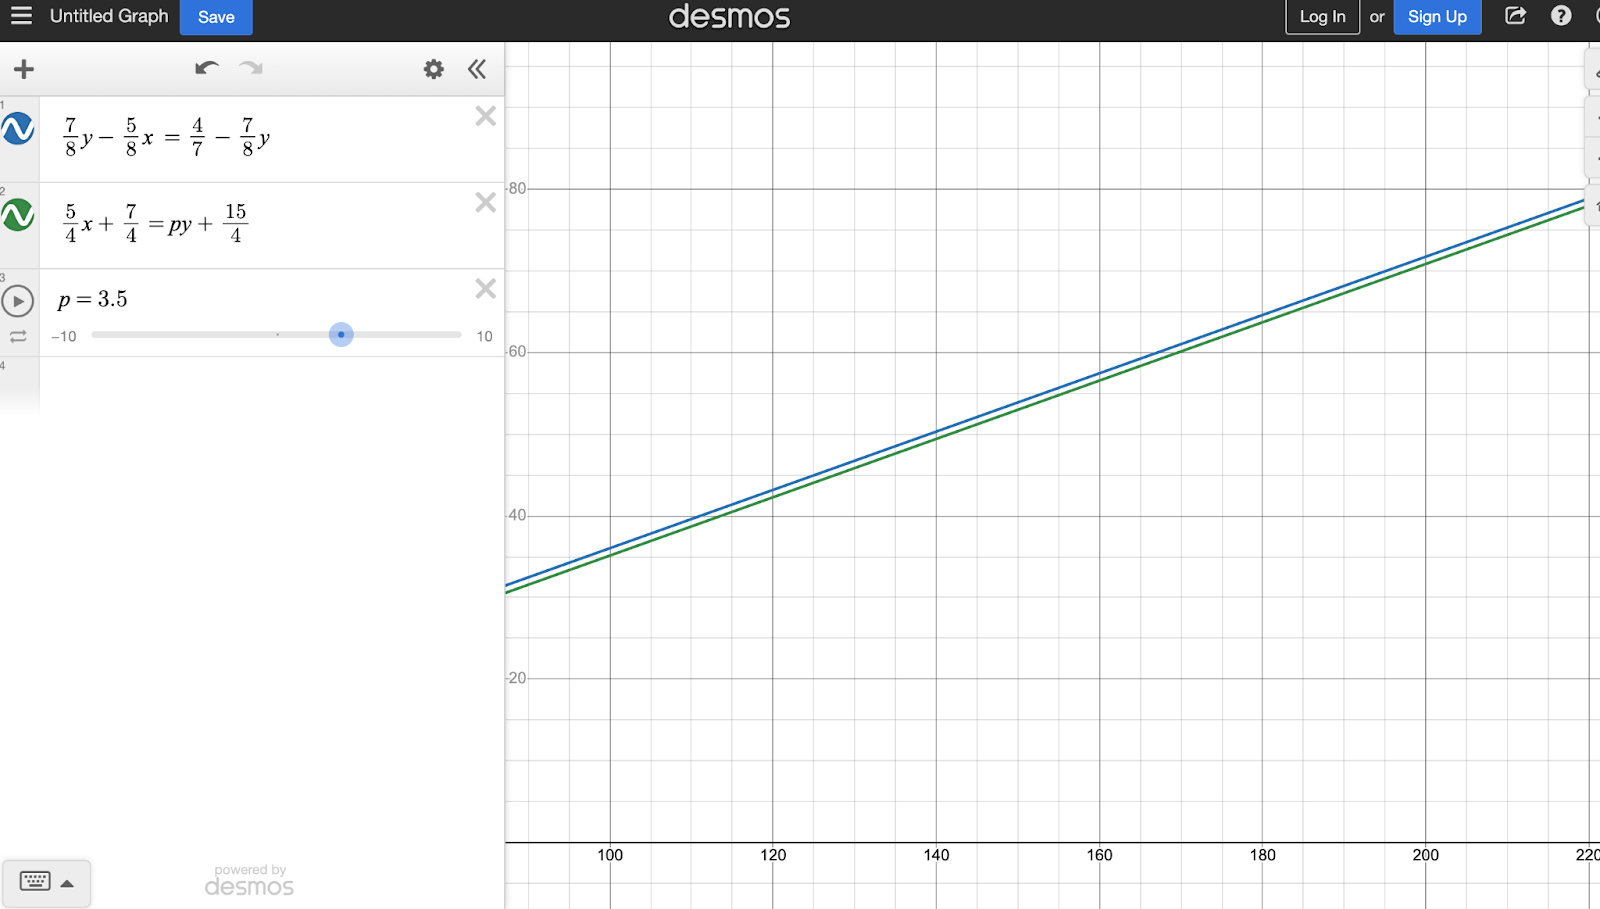
p=-3.5 certainly LOOKS parallel, even zoomed out.
But let’s see if we can confirm our hunch.
How we might solve it is getting those pesky denominators equal to 1.
By hand, let’s multiply both sides of the first equation by 8 to get
7y-5x = (4/7)*8-7y
Don’t worry about simplifying that third term: remember, Desmos is happy to take your inputs as long as you use order of operations meticulously.
Pro tip for Desmos superusers: you can select and deselect the color icon on the left of each row to view and disappear each equation. The reason we only see black here is because black and blue are algebraically equivalent: they’re the same picture (to quote Pam from The Office.)
Huh, now that’s looking closer in the order of terms to the second equation. Let’s rearrange the terms to match our black line entry and multiply each term by 4 to also get rid of its denominator.
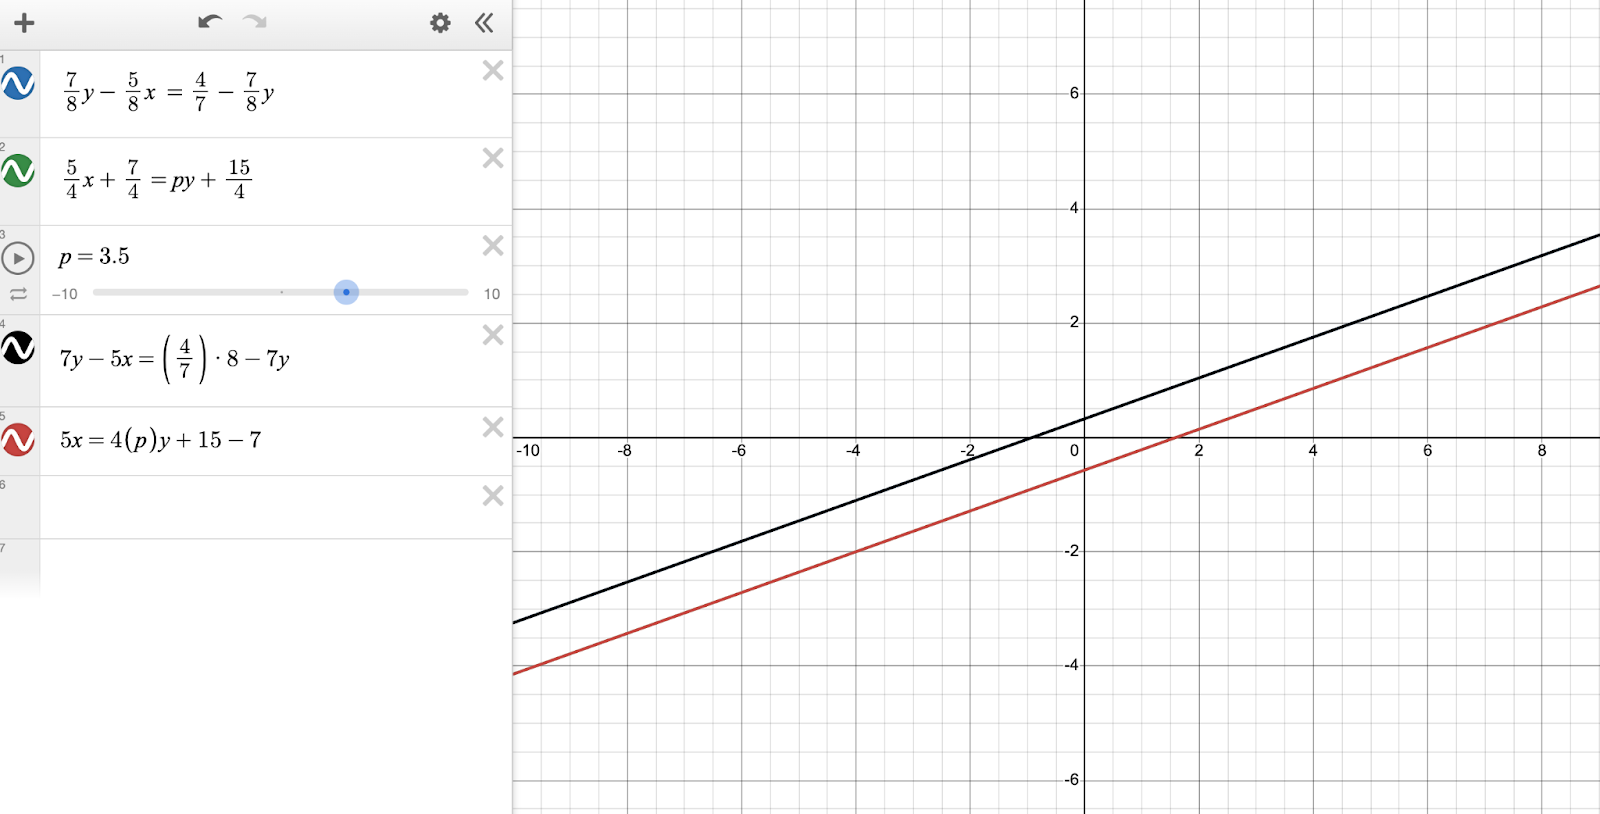
The red line and the green line are indeed equivalent. You press play on the p slider, and feel … relatively confident that you’ve arrived at the right answer.
But you want to be 100% sure. So, we said the standard form of a line would come back. We get to use the regression function of Desmos to do some solving once we’ve correctly set up and interpreted our lines!
AX+BY=C is the standard form (however, much less often taught in American schools than the slope-intercept form).
Let’s simplify each line (on paper) to the standard form:
-5x+14y = 32/7
5x-4py=8
Remember we said the formula for a line’s slope would come back? It’s m=-A/B for ANY line in standard form. We know parallel lines have to have an equal slope. Let’s set up a ratio.
14/-5 =-4p/5
I could cross-multiply, but I want Desmos to solve for p.
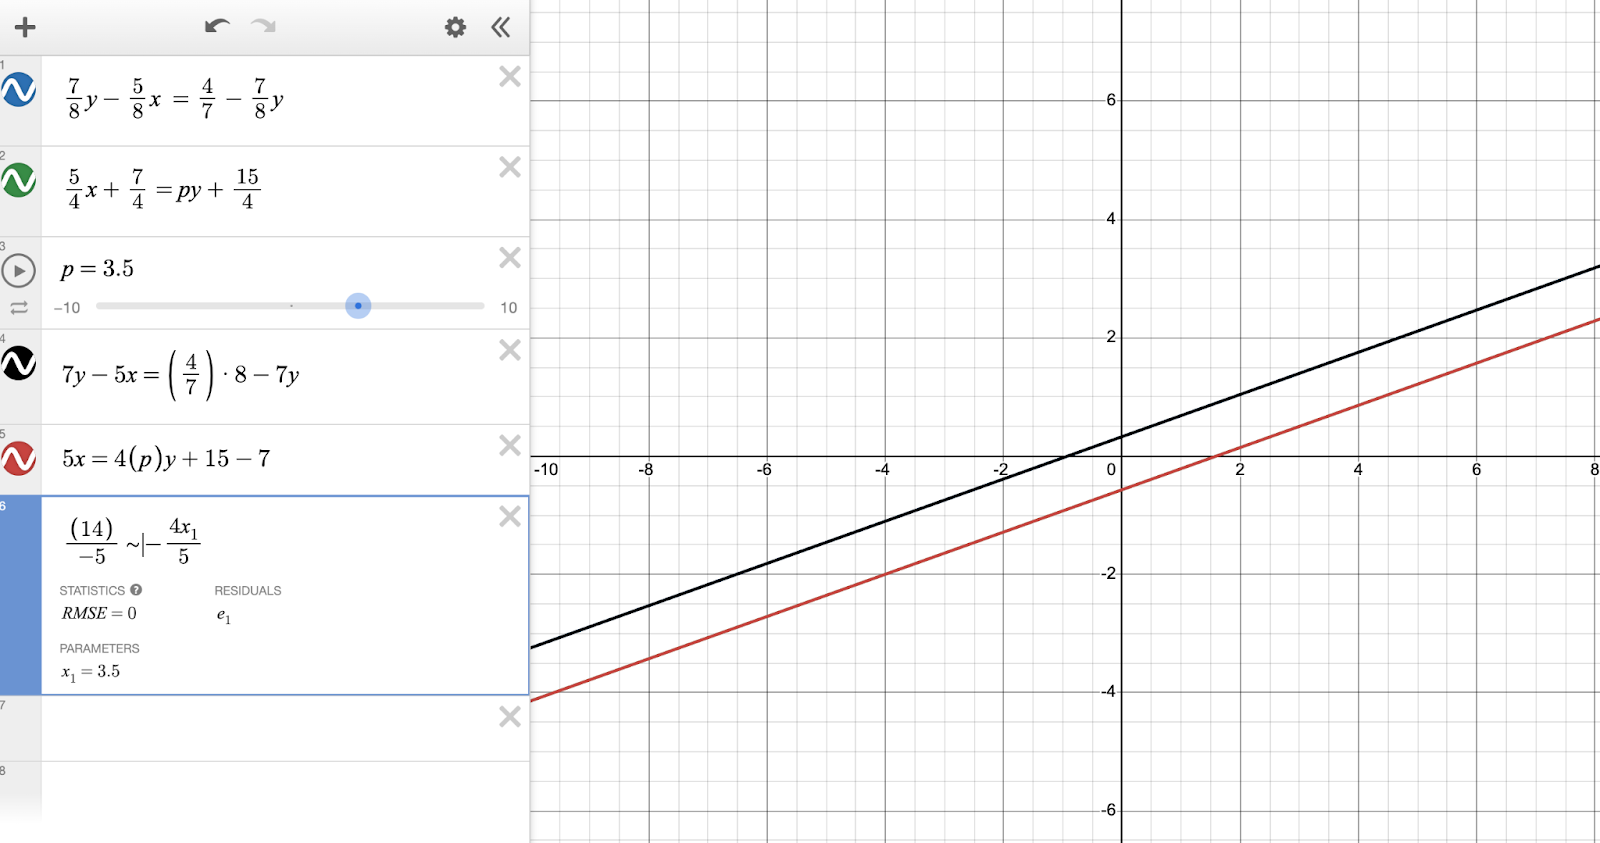
See that ~? It’s called a “tilde,” and it’s one of the most fun, though complex, functions in Desmos.
Rather than producing a graph, I want Desmos to interpret my ratio as needing a value that solves it. This is more powerful than any calculator you can bring into the room on test day, and honestly, a lot of fun once you get the hang of it. (Princess Peach will be cheering you on once you unlock this level.)
As usual, Desmos has a language it requires: for the input in a ratio like this, we need to type x1, which you can quickly input as simply x1 on your keyboard.
The ~ instead of = tells Desmos to solve for x1 — now we’re feeling a lot more confident that we stopped our slider at the right value. The “parameter” is simply the solution, 3.5. Ignore the other values, which are an epiphenomenon of how Desmos does its thinking.
We used a combination of visual display, combining like terms, and the nifty regression function on this problem. Remember, there are many roads to Rome and many ways to get to the correct solution of this problem, as long as you are certain what you are looking for (identical slopes, in this case). Onward!
Interpreting solutions and using estimation
Some students are super comfortable with estimation and understanding that each wrong answer choice is wrong in some unique way. Let’s use that mindset for this question asking for a single solution, and work backwards from the answer choices until we get a match.
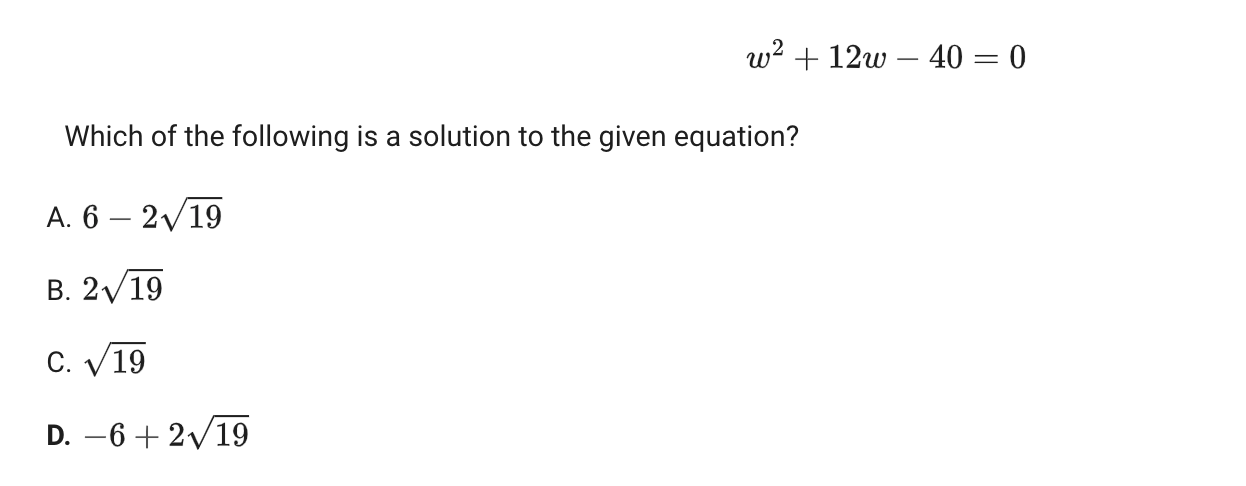
From the form of the equation, of course you can start humming “all around the mulberry bush” to solve this using the Quadratic Formula. That’s not incorrect — however, let’s see if Desmos can give us a less laborious way in.
Remember, replace w with x, since it’s the independent variable.
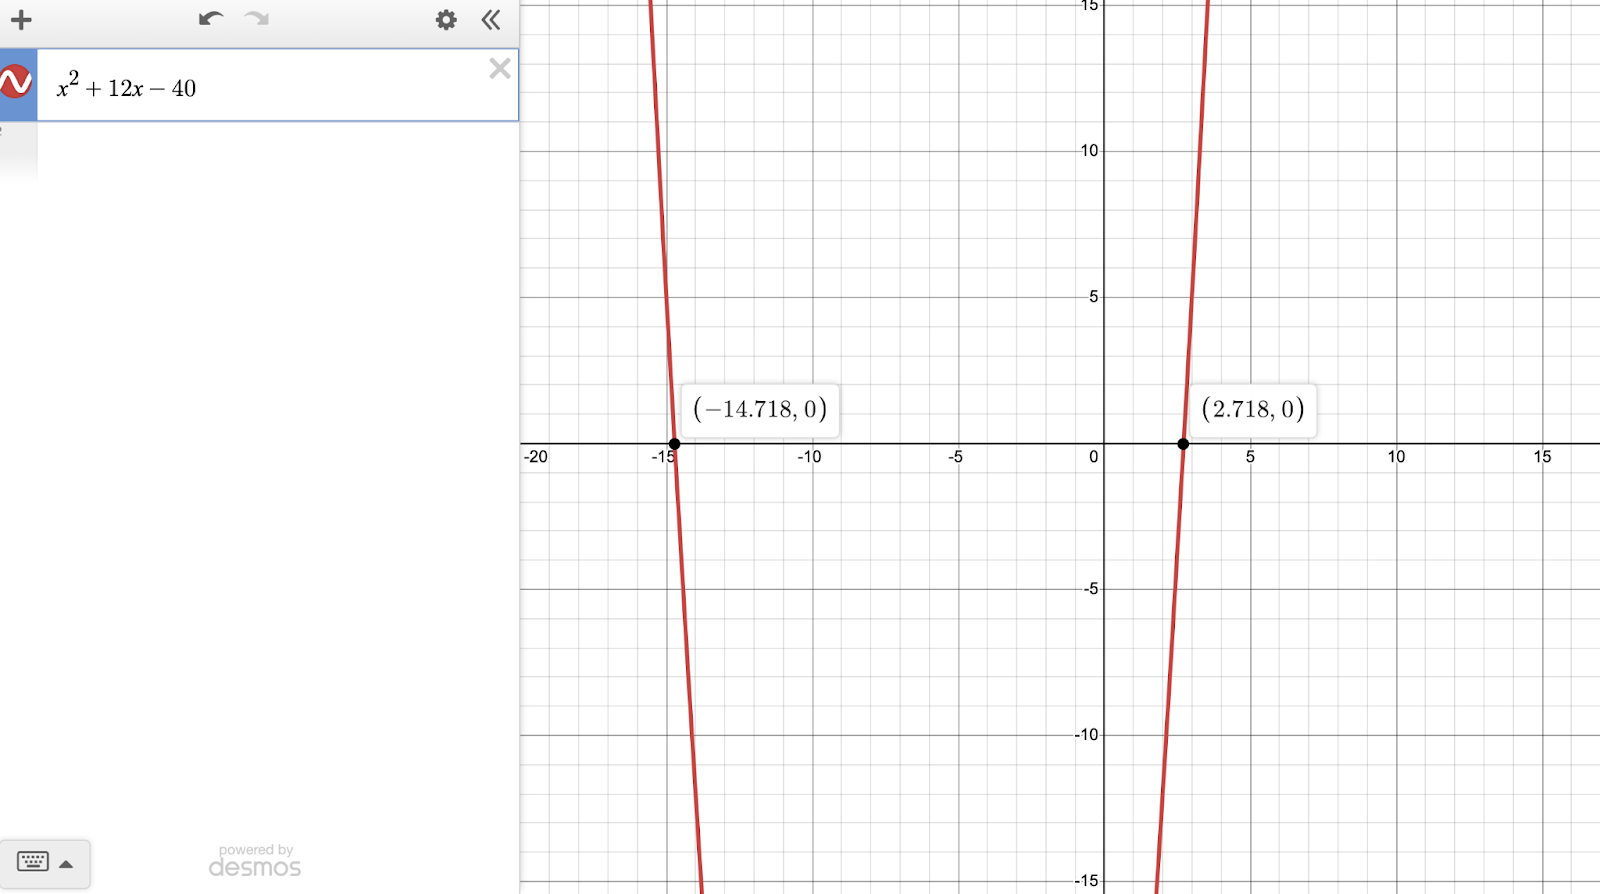
Once we zoom out, we see our two solutions. They’re both irrational, but that’s okay — we’re using estimation, and none of the answer choices are so close as to make rounding errors an issue.
Let’s start with C, since it has the most basic form of the square root of 19. We can make our answer choice bigger or smaller from there, by USING THE ANSWER CHOICES.
DESMOS TIP: IF YOU HAVE A MULTIPLE CHOICE SET OF ANSWERS, YOU CAN USE ROUNDING WITHIN REASON. BE MORE CAUTIOUS IN FREE RESPONSE CHOICE WITH AN IRRATIONAL ANSWER.
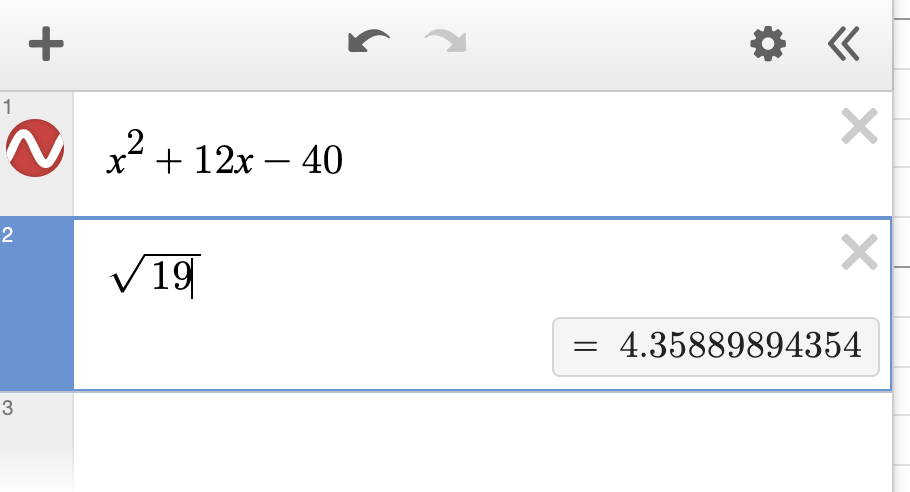
We can use the strikethrough capability in Bluebook to eliminate C: we know (approx.) 4.359 is NOT a solution. But it’s a bit less than twice as large as one of the real solutions. Would doubling it give us the right answer? No.
Type 2* sqrt 19 to confirm. Eliminate B.
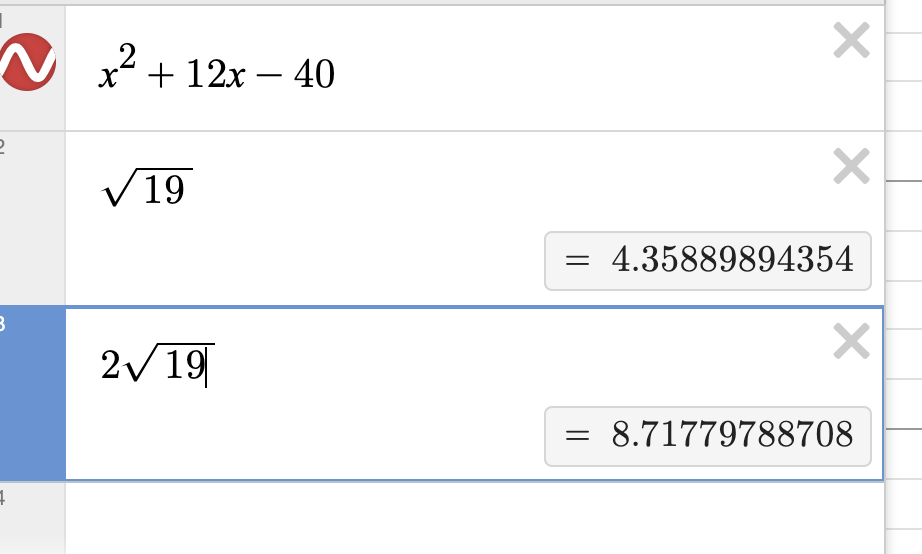
Well, we either need to subtract this value from 6 or subtract six from it to get our answer.
Let’s round to two decimal places and use mental math:
A: 6-8.71≅ - 2.71. Our negative solution was way larger in absolute value. Strike!
D: 8.71-6≅ 2.71. Confirm visually that it's correct, truncated to two decimal places. Home run!
Again, we used some rounding and mental math to get to our answer, rather than being sticklers for maintaining the square root form, rather than its irrational approximation.
But remember, all those answer choices? They’re just numbers, and if you understand that you can eliminate the wrong ones and match the right ones to our Desmos solutions, it’s a great option to plug and chug for students who are comfortable with this approach.
Conclusion
This was a hands-on way to illustrate some ways to leverage Desmos on real SAT problems — but really just scratches the surface of how you can cut down on solution time and visualize functions and expressions in new ways while taking the test.
If you would like to have a tutor work with you to not only understand how to best use Desmos to increase your score on the Digital SAT math section, get in touch with us. One of Shahar’s (our founder) students increased her score from a 600 to a 780 on this section by improving her understanding of how Desmos can be used to hack the exam. Remember, much like a video game, you’re not here to go through an elegant, graduate-level proof of each problem — you’re here to get more points and win. Let’s help you get to the next level.